
Your team spends hours compiling client reports that nobody reads until the meeting. Meanwhile, your clients just want to check their numbers whenever it’s convenient for them — not on your reporting schedule.
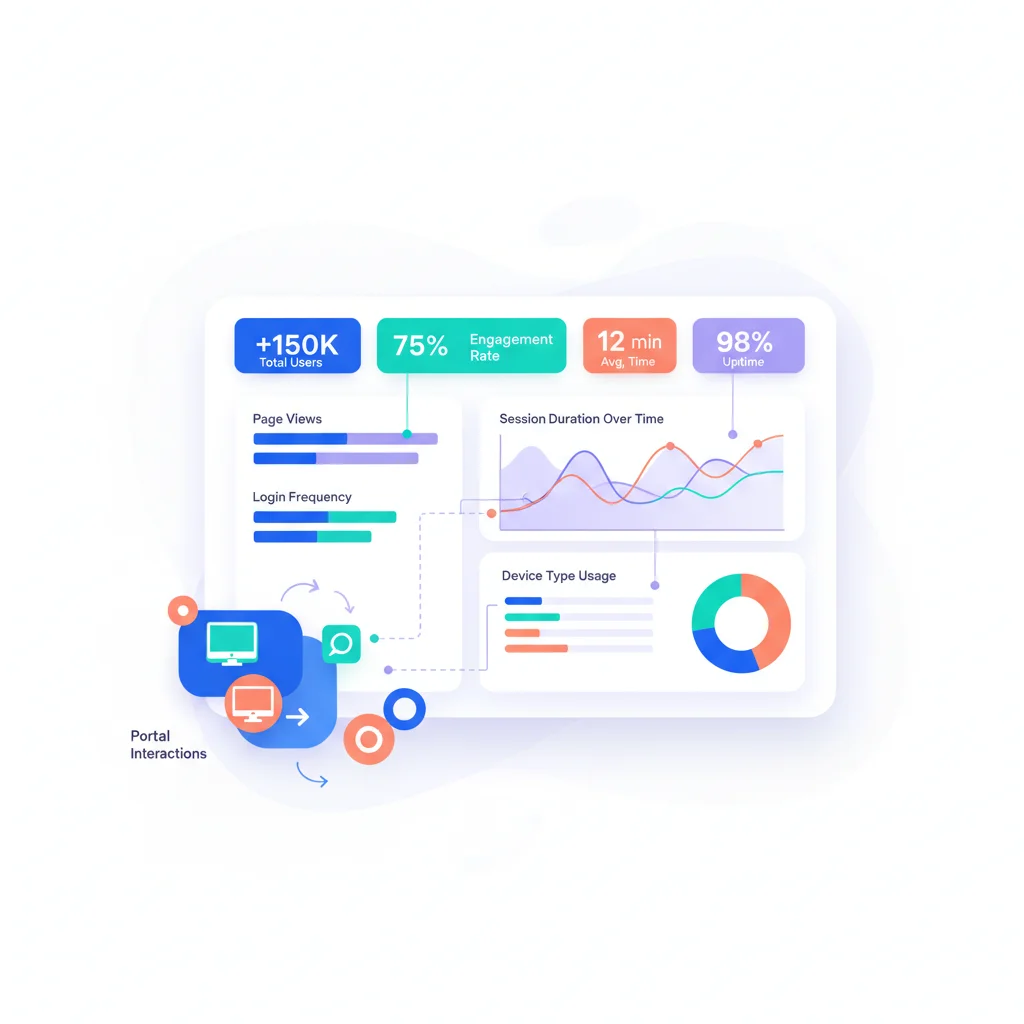
Reporting and analytics in a customer portal give clients a live dashboard they can check anytime. Real-time metrics, beautiful visualizations, and exportable data — all self-service. Your team gets hours back, and your clients feel more informed and in control.
Why Customer-Facing Reporting Matters
Demonstrates value
For service businesses, reporting is how you show clients what they’re getting for their money. Agencies showing campaign performance, MSPs showing tickets resolved and uptime maintained, financial advisors showing portfolio returns — reporting makes the invisible visible.
Reduces reporting overhead
Without self-service reporting, your team spends hours compiling reports, building presentations, and scheduling review calls. Automated dashboards in the portal let clients access their data anytime, freeing your team from repetitive reporting work.
Builds trust through transparency
When clients can see their data in real time — not just when you choose to share it — they trust the relationship more. Transparency is one of the strongest predictors of customer retention.
Key Capabilities
- Real-time dashboards — Live views of KPIs, metrics, and performance data.
- Scheduled reports — Automated delivery of reports on a daily, weekly, or monthly basis (via email with a link to the portal for full details).
- Custom views — Let clients filter, sort, and focus on the metrics that matter to them.
- Exportable data — Download reports as PDF, CSV, or Excel for clients’ internal use.
- Historical comparison — View trends over time, compare periods, and track progress against goals.
- Data visualization — Charts, graphs, and visual indicators that make data accessible to non-technical users.
Reporting by Industry
| Industry | What Clients Want to See |
|---|---|
| Agencies | Campaign performance, ad spend, traffic, conversions, ROI |
| MSPs | Tickets resolved, SLA compliance, security events, uptime |
| Financial Services | Portfolio performance, asset allocation, returns vs. benchmarks |
| SaaS | Usage metrics, API calls, feature adoption, plan utilization |
| Logistics | On-time delivery, shipment volumes, cost per shipment |
| Manufacturing | Order volumes, lead times, quality metrics |
Reporting Tools
Many portal platforms include basic reporting. For more advanced needs:
- Metabase — Open-source BI tool that can be embedded in customer portals.
- Looker — Google’s BI platform with embedding capabilities for customer-facing dashboards.
- AgencyAnalytics — Client reporting platform for marketing agencies.
- Databox — Dashboard tool for pulling metrics from multiple sources.
- Grafana — Open-source visualization platform, often used for technical metrics.