Your portal is live. Customers can log in, view documents, pay invoices, submit tickets. Project complete, right?
But is it actually working? Most portal teams can’t answer that because they never defined what “working” means. No metrics, no benchmarks, no tracking. The portal exists, and everyone hopes for the best.
Hope is not a strategy. Here’s how to measure portal success and use the data to make it better.
Why Most Portals Don’t Measure Anything
Three reasons:
- The portal was a project, not a product. It was built, shipped, and moved to maintenance mode. Nobody owns ongoing performance.
- Nobody agreed on success metrics. Leadership wanted “a portal.” Not “a portal that achieves 70% adoption within 6 months and reduces support tickets by 30%.”
- Tracking wasn’t built in. Analytics was an afterthought — no events, no instrumentation, no dashboard. By the time someone asks “how’s the portal doing?” there’s no data to answer with.
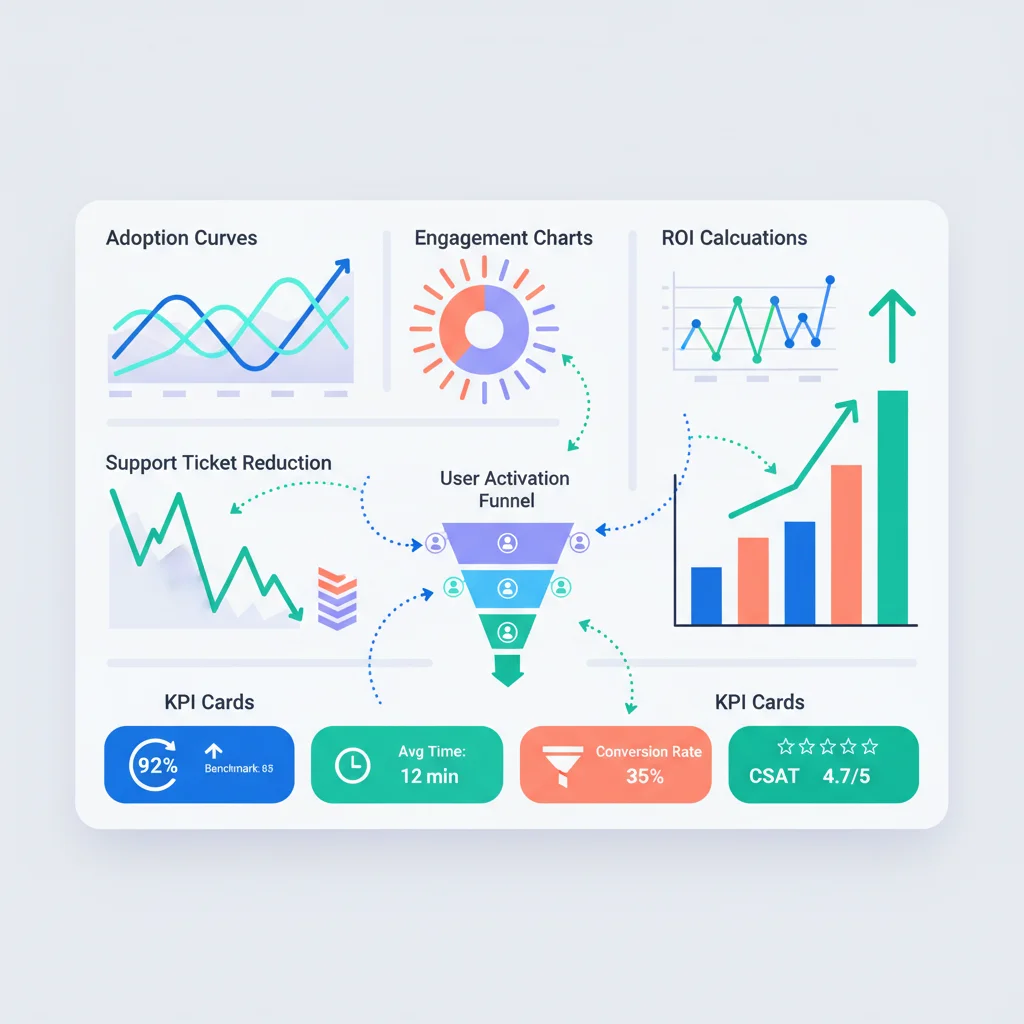
Fix this by defining metrics before launch (or starting now if you’re already live). You need metrics in four categories: adoption, engagement, business impact, and content performance.
Adoption Metrics
Adoption answers the fundamental question: are people using the portal?
Activation rate
What it is: The percentage of invited users who log in at least once.
How to calculate: (Users who have logged in at least once / Total users invited) x 100
Benchmark: 60-80% within 90 days of invitation. Below 50% indicates a problem with your onboarding, invitation process, or perceived value.
What drives it up:
- Clear, compelling invitation emails that explain the benefit
- Immediate value on first login (pre-populated data, pending actions)
- A smooth first-time experience (see our UX design guide)
- Following up with non-activators after 7 and 30 days
What kills it:
- Generic “your account has been created” emails with no context
- Blank dashboards on first login
- Complex registration processes (forced password creation with 15 requirements)
- No reason to log in — nothing useful waiting for them
Monthly active users (MAU)
What it is: The percentage of total registered users who log in at least once per month.
How to calculate: (Users who logged in this month / Total registered users) x 100
Benchmark: 30-50% of total users. Higher for portals with recurring transactional activity (billing, project updates). Lower for portals used only occasionally (annual document access).
Context matters. A portal for accounting firms where clients check quarterly reports will have lower MAU than a SaaS portal where customers manage subscriptions daily. Compare against your own use case, not general benchmarks.
Time to first login
What it is: The average number of days between sending an invitation and the user’s first login.
Benchmark: Within 7 days for 70%+ of users. If most users take weeks to log in, the invitation doesn’t convey urgency or value.
Login frequency distribution
Don’t just look at averages. Look at the distribution:
- Power users (weekly+): These are your champions. What are they doing? How do you get more users here?
- Regular users (monthly): Healthy baseline. What triggers their visits?
- Occasional users (quarterly): May only need the portal periodically. Acceptable for some use cases.
- Dormant users (no login in 90+ days): At risk. They’re probably calling or emailing instead.
Engagement Metrics
Adoption tells you people show up. Engagement tells you what they do when they’re there.
Sessions per user per month
What it is: Average number of login sessions per active user per month.
Benchmark: 3-8 sessions per month for most B2B portals. Highly transactional portals (daily project updates, active ticket management) may see 15+.
Feature usage distribution
Track which portal features are actually used and how frequently:
- % of users who view documents
- % of users who pay invoices through the portal
- % of users who submit support tickets
- % of users who use messaging
- % of users who access the knowledge base
This reveals:
- Features nobody uses — Candidates for redesign, better promotion, or removal.
- Features everyone uses — Your core value. Protect and improve these.
- Feature discovery gaps — A feature that 5% of users try but 90% of those users keep using has a discovery problem, not a value problem.
Pages per session
What it is: Average number of pages viewed per session.
Benchmark: 3-7 pages per session. Very low (1-2) suggests users can’t find what they need and give up. Very high (15+) might suggest navigation confusion — users are clicking around trying to find something.
Session duration
What it is: Average time spent per session.
Benchmark: 3-10 minutes for most portals. Context matters — a customer paying an invoice should be done in 2 minutes. A customer reviewing project deliverables might spend 20 minutes.
Watch for trends more than absolute numbers. If average session duration drops from 8 minutes to 3 minutes over time, it could mean either improved efficiency (good) or decreased engagement (bad). Cross-reference with other metrics to determine which.
Business Impact Metrics
These connect portal performance to business outcomes. They’re why leadership cares.
Support ticket volume
What to measure: Total support tickets per month, and tickets per customer per month.
Expected impact: A well-functioning portal with good self-service capabilities and a solid knowledge base should reduce support ticket volume by 20-40% within 6 months of launch.
How to measure the portal’s impact: Compare ticket volume before and after portal launch, or compare ticket rates between portal users and non-portal users.
Support cost per customer
What to measure: Total support costs divided by total customers, tracked monthly.
Expected impact: Should decrease as portal adoption increases. Measure separately for portal-active customers vs. non-portal customers to isolate the effect.
Time to resolution
What to measure: Average time from ticket creation to resolution.
Expected impact: Portals improve this in two ways — self-service resolves simple issues instantly (reducing the average), and structured ticket submission provides better information upfront (reducing back-and-forth on remaining tickets).
Customer retention rate
What to measure: Annual customer retention rate, segmented by portal usage.
Expected impact: Customers who actively use the portal typically retain at higher rates. This is partly selection bias (engaged customers use portals AND stay longer), but portal adoption also directly increases switching costs and relationship stickiness.
Track retention for portal-active vs. non-active customers. If there’s a significant gap, that’s a compelling case for investing in adoption.
NPS: Portal users vs. non-users
What to measure: Net Promoter Score segmented by portal usage.
Expected impact: Portal users should score higher. If they score lower, the portal is creating frustration rather than value — a sign of UX problems.
Content Metrics (For Knowledge Bases)
If your portal includes a knowledge base, these metrics tell you whether your content is actually helping.
Article views
Track total views and views per article. Identify:
- Top articles — Your most common customer questions. Invest in making these excellent.
- Zero-view articles — Content nobody finds. Either not linked from where customers look, or answering a question nobody has.
Search success rate
What it is: The percentage of searches that result in the user clicking an article (vs. refining the search, searching again, or leaving).
Benchmark: 60-80%. Below 50% means your search isn’t returning relevant results for what customers are asking.
Track failed searches — queries that return zero results or where the user doesn’t click any result. These are your content gaps. Each failed search is a customer who probably submits a ticket instead.
”Was this helpful?” ratings
Add a simple thumbs-up/thumbs-down to every article. Track the helpful rate over time.
Benchmark: 70%+ helpful rate. Articles below 50% need rewriting. Articles consistently above 90% are your templates — study what makes them work.
Search queries with no results
Maintain a list of search queries that returned no results. Review it weekly. Each one represents:
- Content you need to create
- Terminology mismatch (customer says “receipt,” you say “invoice”)
- A feature gap
Setting Up Tracking
What to track (event taxonomy)
Define a consistent set of events:
| Event | Properties |
|---|---|
portal.login | user_id, method (password, SSO, magic link) |
portal.page_view | page_name, section, user_id |
portal.search | query, results_count, section |
portal.search_click | query, article_clicked, position |
portal.document_view | document_id, document_type |
portal.document_download | document_id, document_type |
portal.invoice_view | invoice_id |
portal.invoice_pay | invoice_id, amount |
portal.ticket_create | category, priority |
portal.message_send | thread_id |
portal.kb_article_view | article_id, source (search, browse, link) |
portal.kb_rating | article_id, helpful (yes/no) |
Tools
- Google Analytics 4 — Free, widely supported. Good for page-level analytics and basic event tracking. Limited for user-level analysis.
- Mixpanel — Purpose-built for product analytics. Strong event tracking, funnels, and cohort analysis. Free tier supports up to 20M events/month.
- Amplitude — Similar to Mixpanel. Strong for behavioral analysis and user journey mapping.
- Built-in platform analytics — Many portal platforms include basic analytics. Usually sufficient for adoption metrics, but limited for deep behavioral analysis.
- Custom dashboards — Tools like Metabase, Grafana, or Looker connected to your database for custom metrics.
For most teams, start with the portal platform’s built-in analytics plus GA4. Move to Mixpanel or Amplitude when you need deeper behavioral analysis.
Implementation tips
- Instrument from day one. Adding analytics after launch means losing the most valuable data — early adoption patterns.
- Track users, not just sessions. Anonymous page views are almost useless for portal analytics. You know who your users are — use that.
- Include user properties. Segment by customer size, industry, account age, plan type. Aggregate metrics hide important patterns.
- Test your tracking. Verify every event fires correctly before launch. Bad data is worse than no data.
Reporting Cadence
Weekly: Operational dashboard
A quick-glance dashboard reviewed by the portal team:
- Logins this week (total, unique)
- New activations
- Support tickets submitted through portal
- Failed searches (top queries)
- Any errors or downtime
Monthly: Performance review
A deeper analysis shared with stakeholders:
- Adoption rate trend
- MAU trend
- Feature usage breakdown
- Support ticket volume trend (portal vs. non-portal)
- Top knowledge base articles and gaps
- Action items for improvement
Quarterly: Strategic review
A business-level review for leadership:
- Portal ROI (cost savings from reduced support, improved retention)
- Adoption against targets
- NPS impact
- Feature investment priorities based on usage data
- Benchmark comparison against goals
For a detailed framework on calculating portal ROI, see ROI of Customer Portals.
Using Data to Improve
Metrics are useless if you don’t act on them. Here’s how to translate data into action.
Low adoption (activation < 50%)
The problem is at the top of the funnel. Users aren’t showing up.
- Improve invitation emails. Personalize them. Explain the specific benefit. Include a direct login link, not a generic URL.
- Simplify registration. SSO or magic links remove friction. If you require password creation, don’t impose excessive complexity rules.
- Create urgency. Tie the first login to something the customer needs — “Your Q3 report is available in your portal.”
- Follow up. Automated reminder at 3, 7, and 14 days for non-activators.
Low engagement (MAU < 20%)
Users activated but aren’t coming back. The portal isn’t part of their workflow.
- Audit the value proposition. Can customers accomplish their key tasks in the portal, or do they still need to email/call for important things?
- Add notification triggers. Email customers when something new appears in their portal — new document, status update, invoice ready.
- Improve the dashboard. Show pending items that need attention. Give users a reason to log in.
- Review UX. Run a click audit on the top 5 tasks. Reduce friction.
High support volume despite portal
Customers are using the portal but still submitting lots of tickets. Self-service isn’t working.
- Analyze ticket topics. What are people asking about? Is there a knowledge base article for it?
- Review search analytics. Are customers searching and failing? Fill content gaps.
- Check article quality. High-view, low-helpfulness articles need rewriting.
- Improve article discoverability. Link help content contextually — a billing error page should link to billing help articles.
Feature unused
A feature exists but usage is near zero.
- Discoverability problem? Do users know it exists? Try contextual prompts, dashboard widgets, or in-app announcements.
- Value problem? Does the feature solve a real need? Talk to customers. If nobody wants it, consider removing it — fewer features done well beats many features done poorly.
- Usability problem? Maybe users tried it and gave up. Check for drop-offs in the feature flow.
Feature overloaded
A feature is used heavily and generating complaints or support tickets.
- Scale it. Invest in performance, UX improvements, and edge case handling for your highest-value features.
- Extend it. If everyone uses invoicing, what adjacent capabilities would make it more useful? Payment plans, automatic receipts, export options.
Start Now, Improve Continuously
If your portal is already live without analytics, start simple:
- Add GA4 or your platform’s built-in tracking. Get basic page views and session data flowing.
- Define 3-5 key metrics. Activation rate, MAU, support ticket volume, and one engagement metric.
- Create a monthly review habit. Even 30 minutes reviewing data monthly is infinitely better than never looking.
- Set targets. Without targets, metrics are just numbers. Define where you want to be in 6 months.
- Build from there. Add event tracking, deeper analysis, and more sophisticated tools as your practice matures.
Measurement isn’t about dashboards and tools. It’s about building a feedback loop: measure, learn, improve, repeat. Portals that measure consistently outperform portals that don’t — because they know where to invest.